All email received at KPU passes through multiple filters to prevent spam email and viruses from reaching the university's email system. Although this system is robust and constantly updated, a small amount of spam gets through because it is not detected as spam.
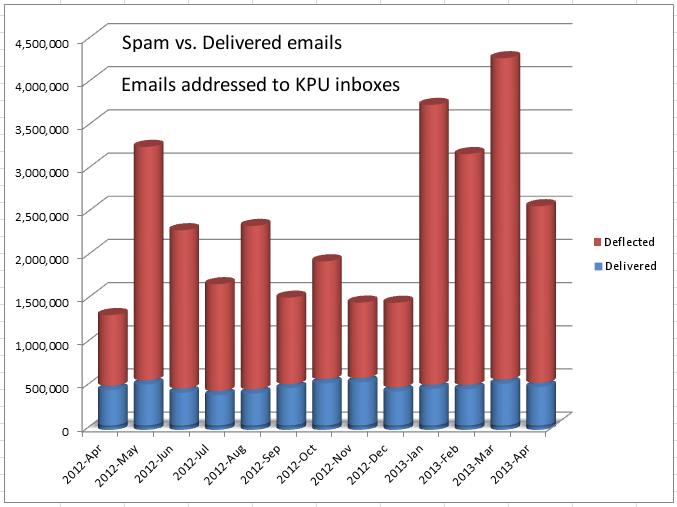
The graph below depicts the monthly statistics from the email filtering system. The blue portion of the column represents emails that are delivered. The red portion is the emails that are identified as spam or viruses and therefore rejected. The numbers are correct; we are talking about millions of emails.
The graph below depicts the monthly statistics from the email filtering system. The blue portion of the column represents emails that are delivered. The red portion is the emails that are identified as spam or viruses and therefore rejected. The numbers are correct; we are talking about millions of emails.
| Month | Delivered | Total | |
| 2012-Apr | 461,832 | 1,279,372 | 36.1% |
| 2012-May | 525,352 | 3,227,650 | 16.3% |
| 2012-Jun | 429,817 | 2,261,734 | 19.0% |
| 2012-Jul | 402,066 | 1,636,622 | 24.6% |
| 2012-Aug | 421,222 | 2,311,627 | 18.2% |
| 2012-Sep | 481,977 | 1,480,740 | 32.5% |
| 2012-Oct | 539,253 | 1,902,362 | 28.3% |
| 2012-Nov | 550,955 | 1,423,805 | 38.7% |
| 2012-Dec | 444,044 | 1,421,719 | 31.2% |
| 2013-Jan | 473,374 | 3,712,905 | 12.7% |
| 2013-Feb | 472,423 | 3,143,518 | 15.0% |
| 2013-Mar | 534,314 | 4,253,212 | 12.6% |
| 2013-Apr | 495,688 | 2,539,662 | 19.5% |
| AVERAGES | 479,409 | 2,353,456 | 20.4% |
On average, only 20% of all email addressed to KPU is legitimate email. The other 80% is Spam email.
Spam in 2013
The amount of spam targeting KPU inboxes has jumped dramatically in the first few months of 2013. As of April, only 14.5% of email addressed to KPU are delivered.
For every 10 emails delivered on average 69 emails are bounced.
For every 100 emails delivered on average 690 emails are bounced.
If you received 1 spam for every 100 emails that would mean that out of 691 potential spam emails only 0.14% made it through.
For additional information, support, training, or assistance contact us,
 IT Service Desk @ 604.599.2116
Email: servicedesk@kpu.ca
Location: 1st Floor, Arbutus Building, Surrey Campus